
What chance does your dropshipping store have?
Sure, cohort analyses on your own data is fun. But have you ever tried to analyze the cohorts of a publicly traded company?
For this example, I’m going to try to perform some cohort analyses on Shopify. I chose Shopify because:
- I work in e-commerce so it’s helpful for me to better understand the landscape.
- I’ve had friends dabble in dropshipping and Shopify stores of their own.
- This was the data I could readily find.
What Shopify Says About Its Cohorts
Let’s head over to Shopify’s annual report found here. First, on page 94 we find that Shopify’s revenue in 2019 is $1.57B. Then, after searching the document for “cohort” we find the below chart.
This chart is showing how much revenue Shopify retains from its cohorts of “merchants” (Shopify store owners). We can see that revenue from all of its cohorts from 2019 appear to equal the annual revenue figure of $1.57B so we’re definitely in the right place.
Next, I want to decompose this chart to see precisely how much revenue Shopify retains from its annual cohorts. I’ll take the chart to a site that will count the pixels of each of these bars, and tell me each cohort’s revenue contribution.
We find the following
| Year 0 | Year 1 | Year 2 | Year 3 | |
|---|---|---|---|---|
| Pre-2017 Cohort | $390M | $527M | $601M | $680M |
| 2017 | $143M | $296M | $285M | |
| 2018 | $174M | $370M | ||
| 2019 | $243M |
If you’re Shopify, you have to be ecstatic that annual revenue retention from your cohorts from Year 0 to Year 1 is ~200%.
My theory of what’s happening:
- Each year, large number of merchants sign up and start a Shopify store.
- Most of these are unsuccessful, but the ones who are successful are really, really successful.
- Shopify further monetizes these successful ones with app subscriptions, Shopify Pro, etc.
Tracking Shopify Cohorts in the Wild
Shopify publicly shares their cohorts’ revenue retention, but doesn’t share anything about customer churn rate. How long does a Shopify merchant survive?
We can answer that question! I’m going to use a sample dataset provided by BuiltWith, but the same principles should apply if you had a more complete dataset. You can find the dataset on Amazon’s Data Exchange marketplace.
In the dataset, we find 5,067 websites that have run Shopify technology. The dataset covers an 8 year period from October 2011 to May 2019. About 80% of the observations are from 2017 or later.
I’m going to use survival analysis techniques and the lifelines library to describe how long Shopify merchants last.
Let’s get the data in a format we can use:
import pandas as pd
import json

lines = []
with open('dataset_sample-2/example_tech.json') as t:
	lines = t.read().splitlines()

df_inter = pd.DataFrame(lines)
df_final = pd.json_normalize(df_inter[0].apply(json.loads),
'Technologies', ['Domain', 'FirstIndexed', 'LastIndexed'])

shopify_df = df_final.loc[df_final['Name'] == 'Shopify']
Survival Analysis 101
Now we have a dataframe of websites and the duration of which they have run Shopify. These websites fall into several buckets that survival analysis is built to handle:
- When first indexed, the website did not have Shopify. They were subsequently indexed and found to have Shopify. Then, they dropped Shopify sometime before they were last indexed. We have complete visibility on the duration the website ran Shopify. This is ideal!
- When first indexed, the website did have Shopify. We don’t really know when they added Shopify. Formally, this data is known as “left censored.”
- When last indexed, the website was still running Shopify. We don’t really know if or when they dropped Shopify. Formally, this data is known as “right censored.”
Imagine trying to solve the challenges of the second and third buckets! Well, we are going to do just that. Let’s further prepare our data for some survival analyses.
First Fit
First, we’ll identify which rows are left censored. We’re also going to assume right censoring occurs when the LastDetected date equals LastIndexed, so we’ll throw out those values.
shopify_df.loc[shopify_df['FirstDetected'] >
shopify_df['FirstIndexed'], 'LeftCensored'] = 'False'
shopify_df.loc[shopify_df['FirstDetected'] ==
shopify_df['FirstIndexed'], 'LeftCensored'] = 'True'
shopify_df['LeftCensored']
shopify_df['LeftCensored'].map({'False':False, 'True':True})

shopify_df.loc[df_final['LastDetected'] == shopify_df['LastIndexed'],
'LastDetected'] = None
We find that 65% of our observations are left censored.
Now, we’ll use datetimes_to_durations from lifelines to calculate the duration a website ran Shopify. If the data were right censored, we’ll use LastIndexed date as the fill date for the duration calculation. datetimes_to_durations will automatically indicate that it was right censored.
shopify_df['T'], shopify_df['E'] =
datetimes_to_durations(shopify_df['FirstDetected'],
shopify_df['LastDetected'],fill_date = shopify_df['LastIndexed'])
shopify_df.head()
Because we have heavily left censored data, we will use the fit_left_censoring method of the Kaplan-Meier fitter in lifelines.
from lifelines import KaplanMeierFitter
kmf = KaplanMeierFitter()
kmf.fit_left_censoring(shopify_df['T'], shopify_df['E'])
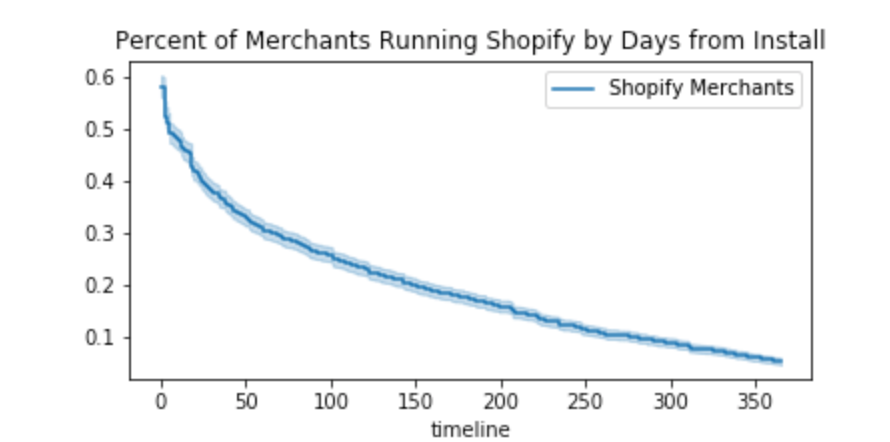
kmf.plot(label='Shopify Merchants', at_risk_counts=True,
loc=slice(0.,365.))
plt.title('Percent of Merchants Running Shopify by Days from Install')
kmf.median_survival_time_We find that the median survival time for Shopify merchant is 5 days! And by 365 days after installing Shopify, only 5% of sites are still running it.
Yearly Cohort Analysis
Let’s segment the merchants by the year Shopify was first detected, and see how churn compares overtime. Remember, Shopify has publicly declared the revenue retention from some of these cohorts.
shopify_2017 = shopify_df.loc[(shopify_df['FirstDetected']
<= '2017-12 31') & (shopify_df['FirstDetected'] >= '2017-01-01')]
shopify_2018 = shopify_df.loc[(shopify_df['FirstDetected']
<= '2018-12-31') & (shopify_df['FirstDetected'] >= '2018-01-01')]

kmf.fit_left_censoring(shopify_2017['T'], shopify_2017['E'])
kmf.plot(label='2017', loc=slice(0.,365.))
kmf.fit_left_censoring(shopify_2018['T'], shopify_2018['E'])
kmf.plot(label='2018', loc=slice(0.,365.))
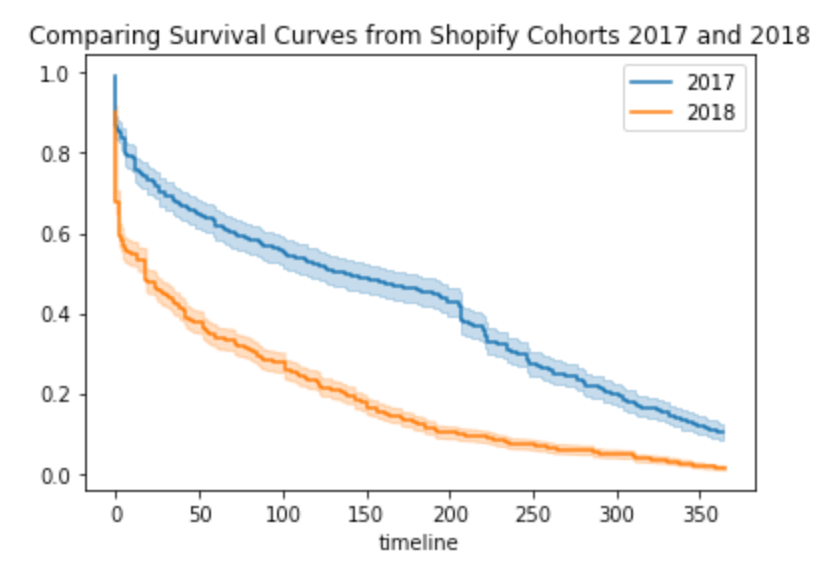
We should probably be a little surprised that 2018’s retention shows worse here, considering that its revenue retention was stronger than 2017.
Summary and Final Thoughts
Given a sample dataset of Shopify merchants, we were able to estimate the churn rate of Shopify merchants. We found that only 5% of merchants were still on Shopify one year after first installing it. This seems unbelievably low considering the public declarations of cohort revenue.
For the following reasons, it’s likely that the dataset quality was poor and affected our analyses:
- 65% of observations were left censored.
- 60% of observations were right censored.
- It spanned 8 years, but only had 5,067 websites. Today, there are over 3M websites running on Shopify according to BuiltWith.
As a next step, we could take that 95% annual merchant churn rate and try to figure out when Shopify might run into growth problems. Then, we could perform a bottoms-up corporate valuation to see if its stock is over or underpriced. Perhaps for another time!